April honeypot report
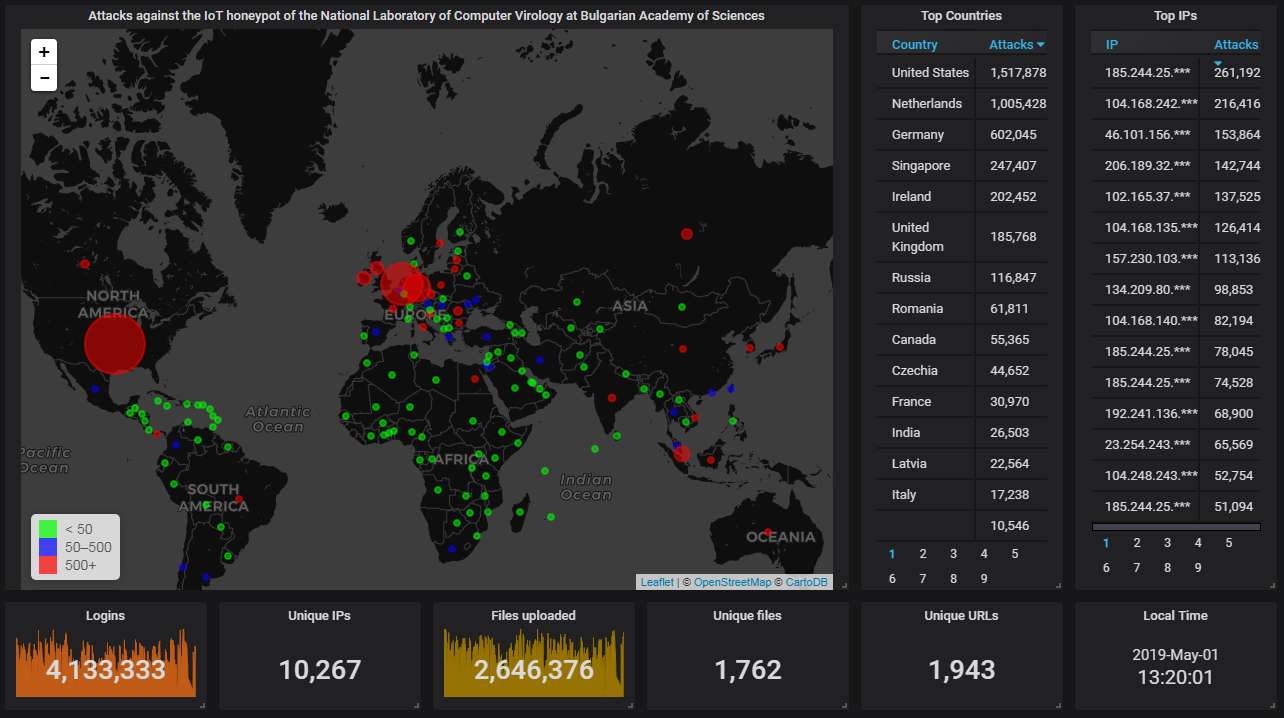
First, the data from our Telnet & SSH honeypot. The big picture looks like this. As usual, most attacks have come from the USA:
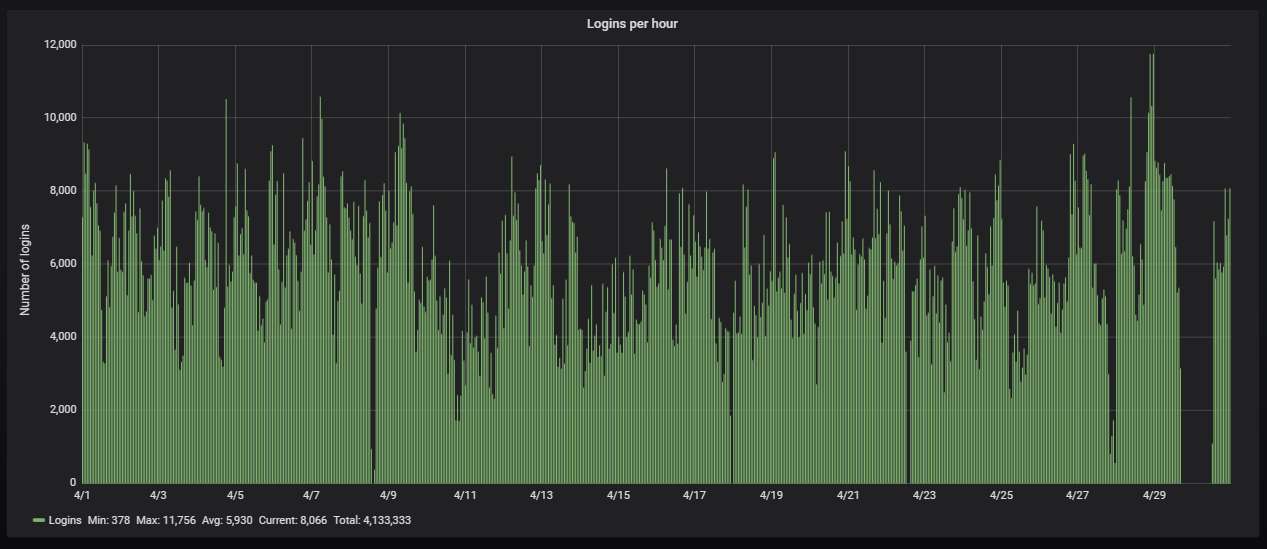
Here is how the hourly activity looks like. Pretty steady traffic, more than 1.6 attacks per second. The gaps are caused either by maintenance, or because the power has been off - except the one at the end, which was caused by our router failing during the Orthodox Easter holidays and nobody being around to restart it. You'll see similar gaps on the hourly activity charts of the other honeypots too.
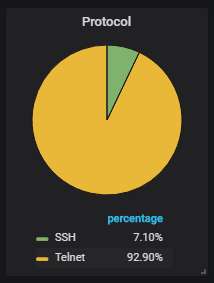
As usual, more than 90% of the attacks are via Telnet, the rest are via SSH:
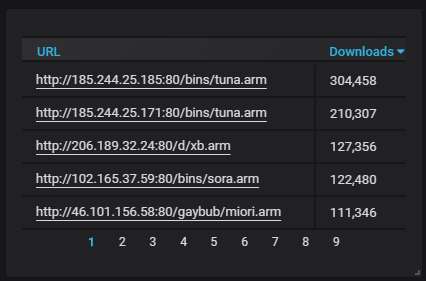
The top-5 URLs from which malware was most actively uploaded to the honeypot. Mirai variants all of them, as usual, although the original variant is not among them.
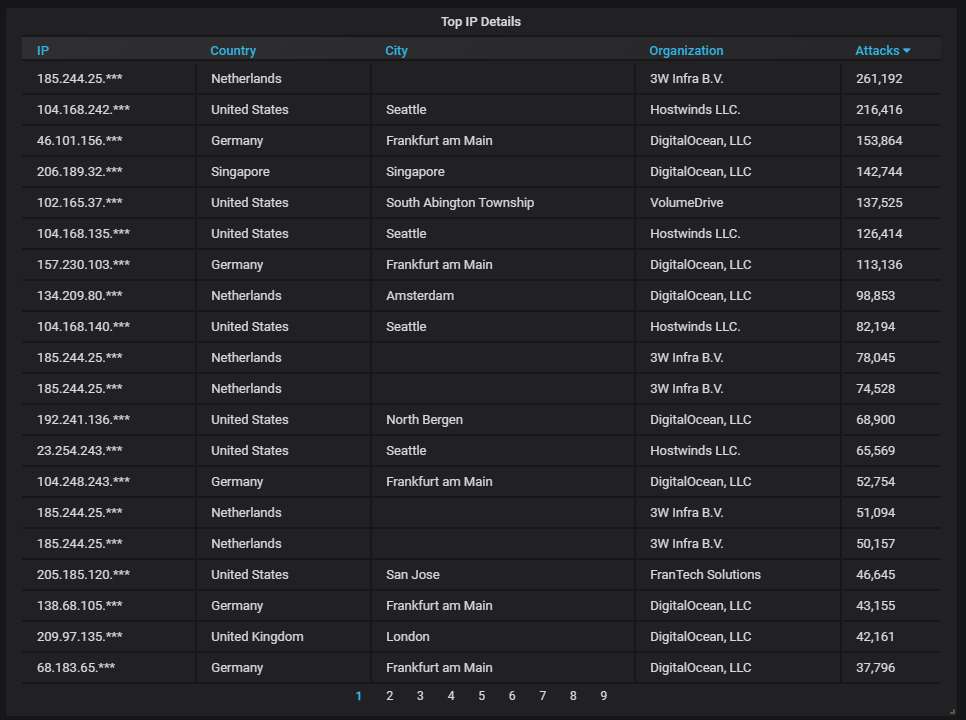
Details about the top-20 most actively attacking IPs. As usual, DigitalOcean is heavily present but, surprisingly, doesn't hold the top spot.
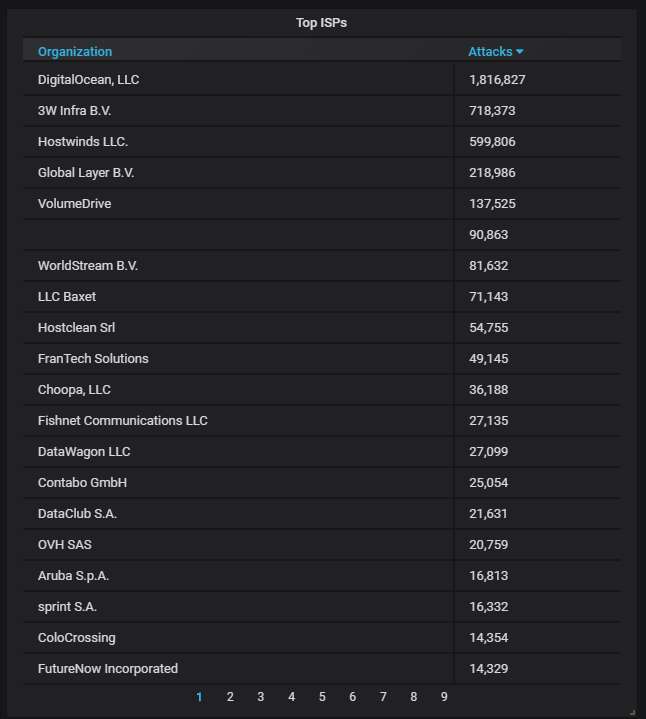
The top-20 most actively attacking organizations. DigitalOcean is at the top, as usual, causing nearly three times more attacks than the next contender:
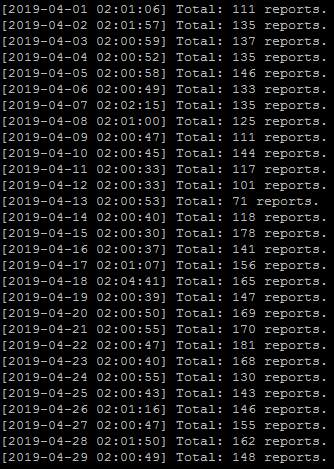
As you can see, I've been sending 100-150 automated abuse reports to DigitalOcean every day - but it doesn't seem to be helping very much. (The report from April 30 is missing because the honeypot was off-line due to the router being down.)
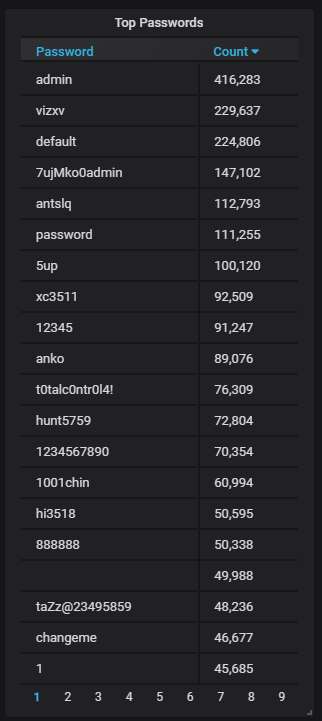
The top-20 passwords that are the most often used by the attackers; nothing unusual here:
Moving on to our SMB honeypot.
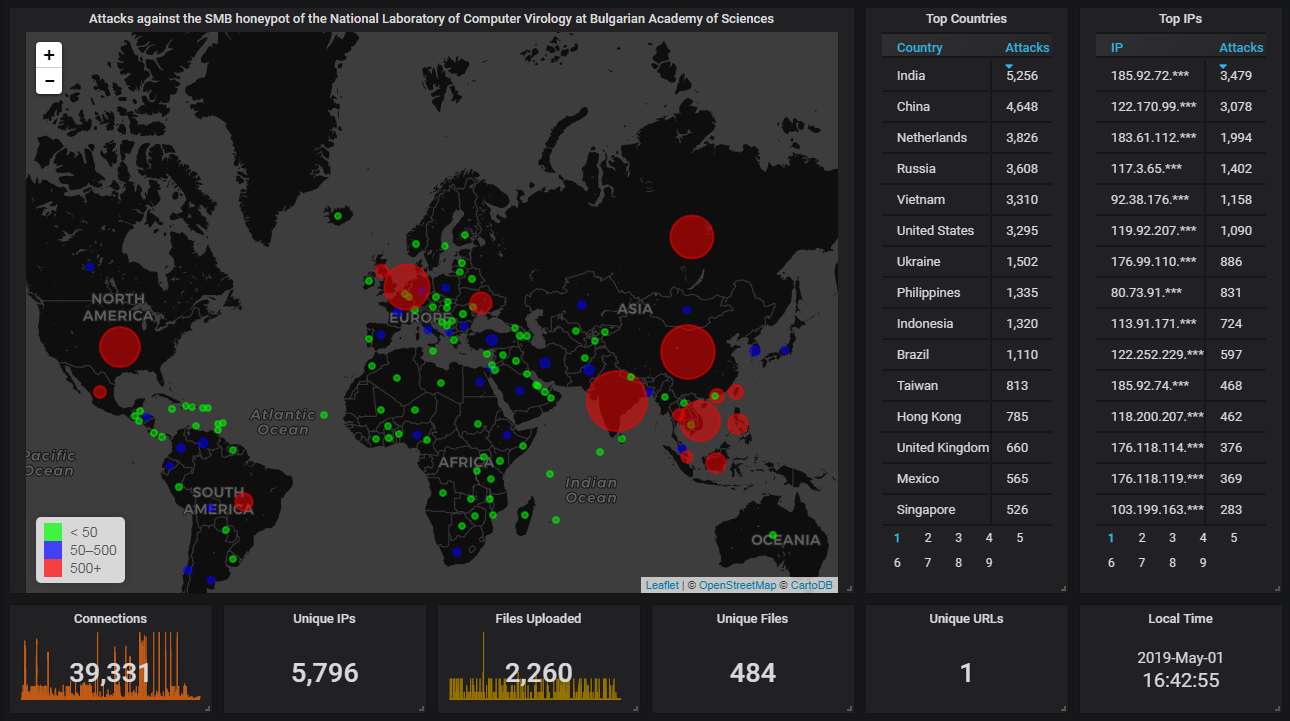
First, the big picture. Here India and China hold the top spot, with the Netherlands, Russia, Vietnam, and the USA not far behind:
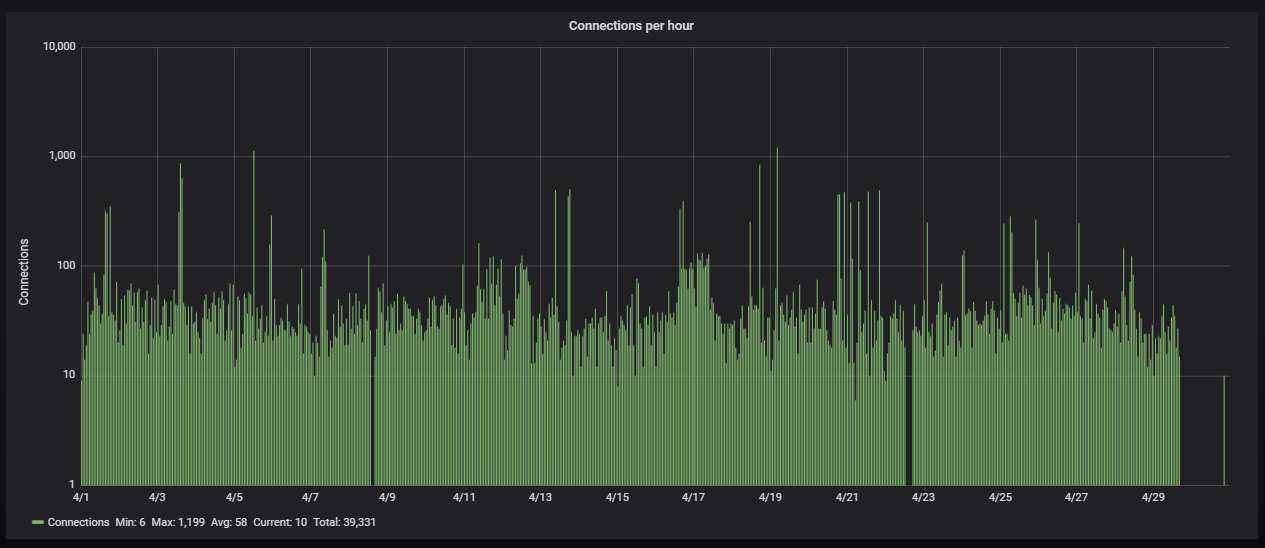
Hourly activity, showing averagely one attack per minute. I've switch to a logarithmic scale, otherwise the lonely spikes of nearly a thousand attacks coming from a single IP (usually infected with a WannaCry variant) tend to drown everything else. Otherwise the traffic is pretty steady, albeit much lower than the one that the Telnet honeypot gets. The gap at the end, caused by the honeypot being off-line due to a malfunctioning router, is clearly visible. The other two gaps were caused by us taking the honeypot machine down for backup and maintenance.
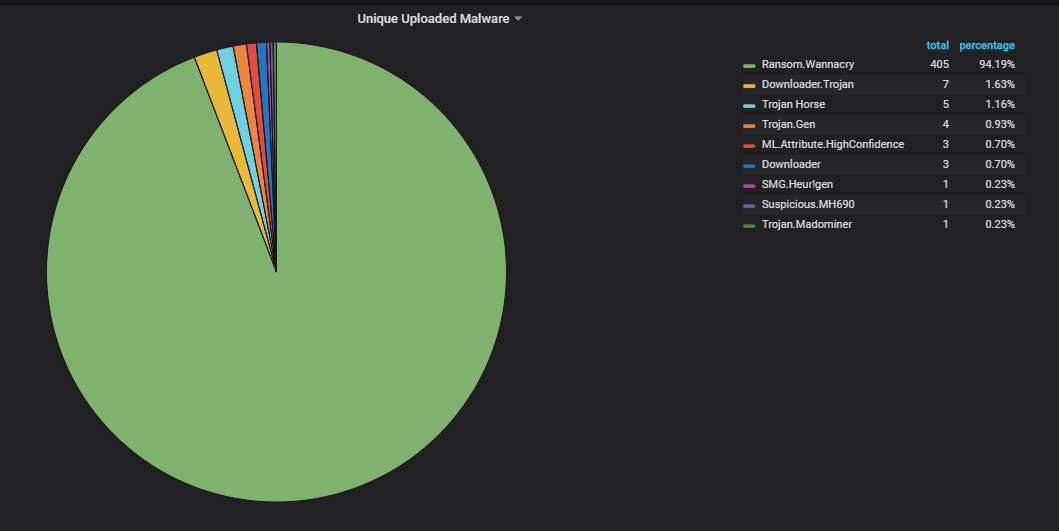
Unique uploaded malware variants, according to Symantec's scanner. Yup, those are 400+ different WannaCry variants. All of them have been patched so that they don't check the kill switch. They also don't encrypt because the ransomware part is corrupted.
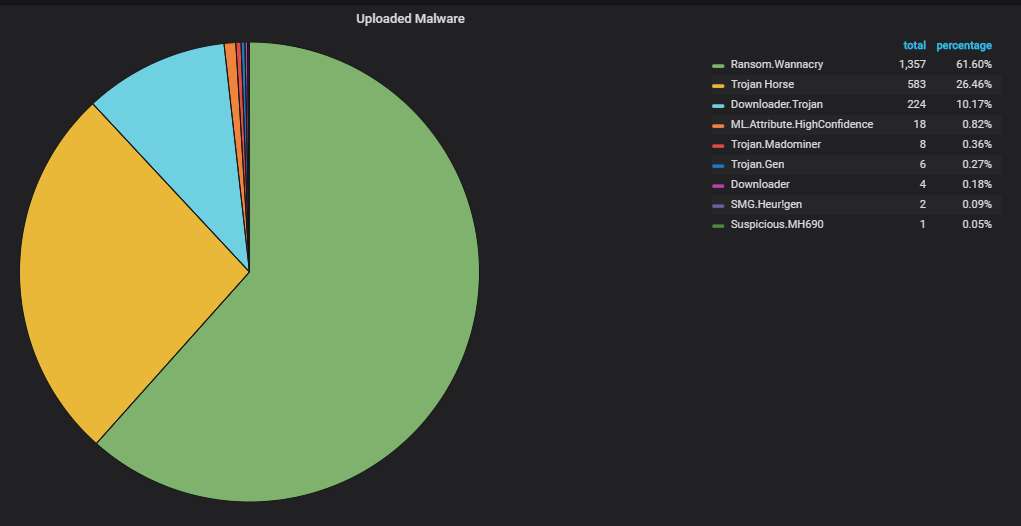
Note that WannaCry uploads dominate, although not as overwhelmingly, even if we don't count only the unique variants:
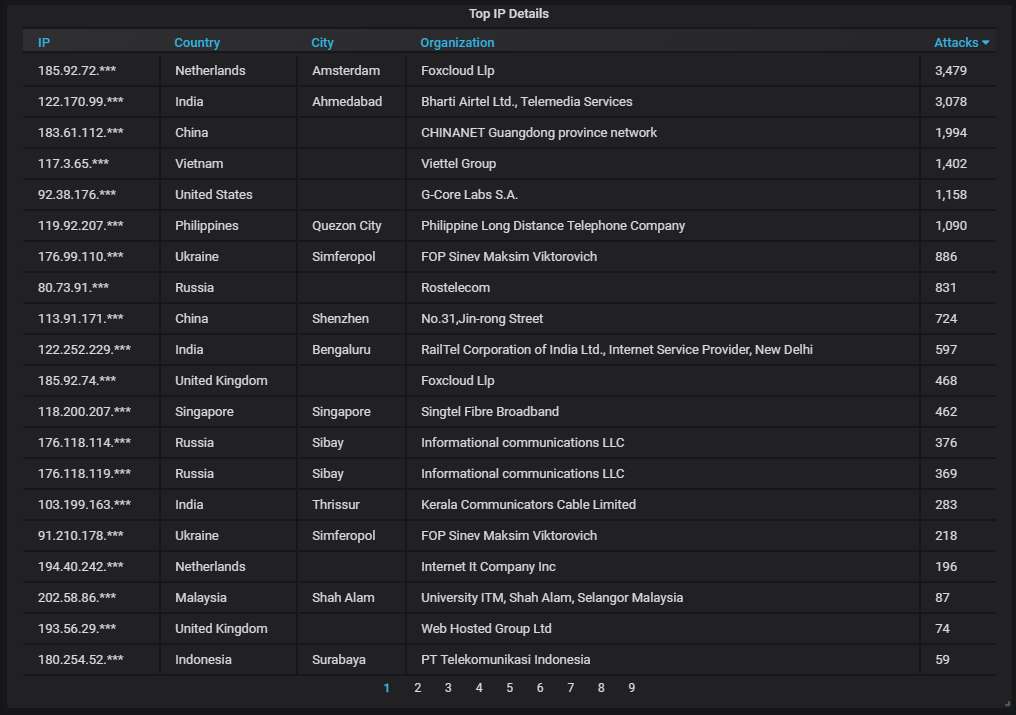
Details about the top-20 most actively attacking IPs:
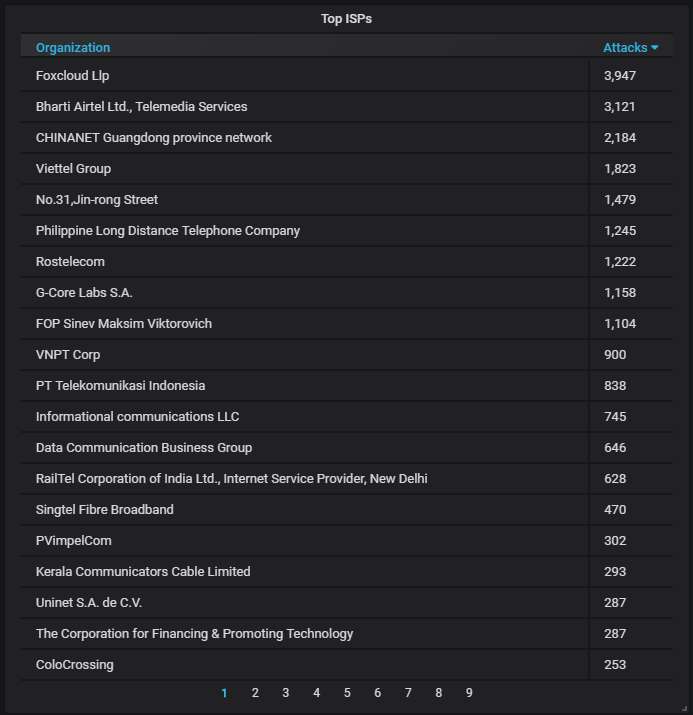
The top-20 organizations from which most of the attacks are coming from:
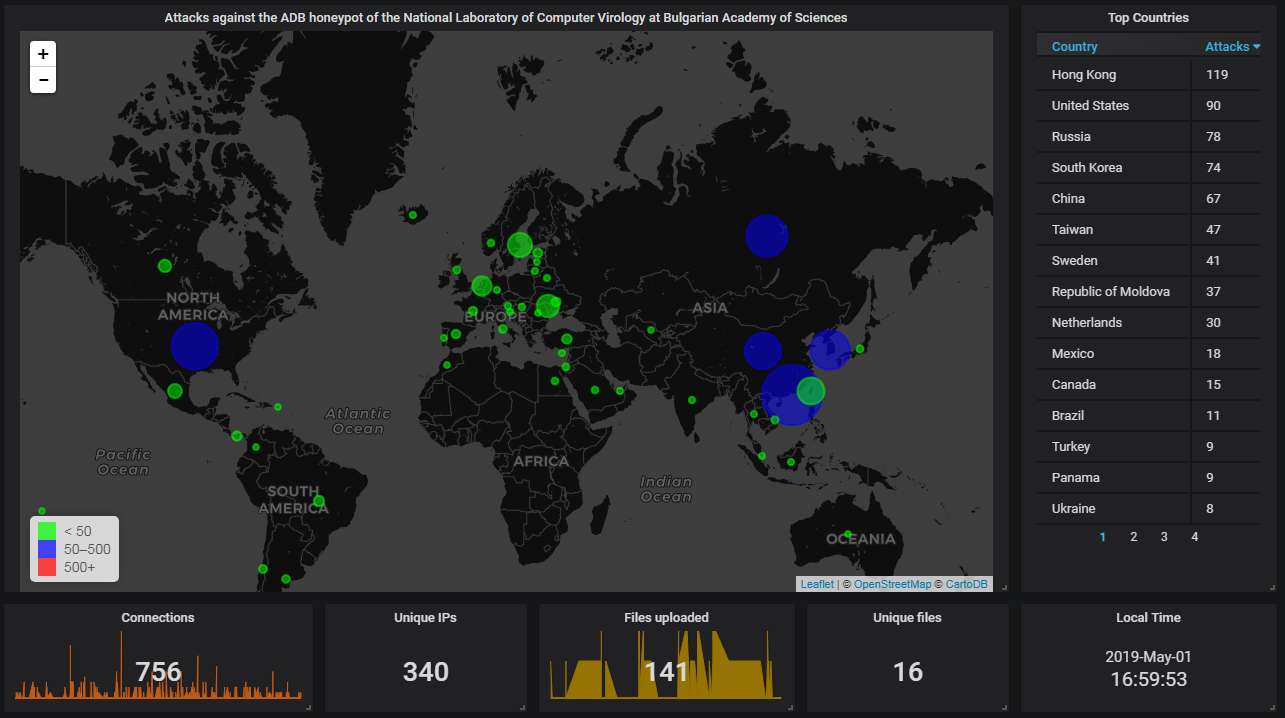
Finally, the data from our ADB honeypot.
The big picture shows this time Hong Kong holds the top spot, which is not unusual. Generally, the Far Eastern countries (China, Hong Kong, South Korea) seem to have a huge population of devices with the ADB port open to the Internet with no authentication.
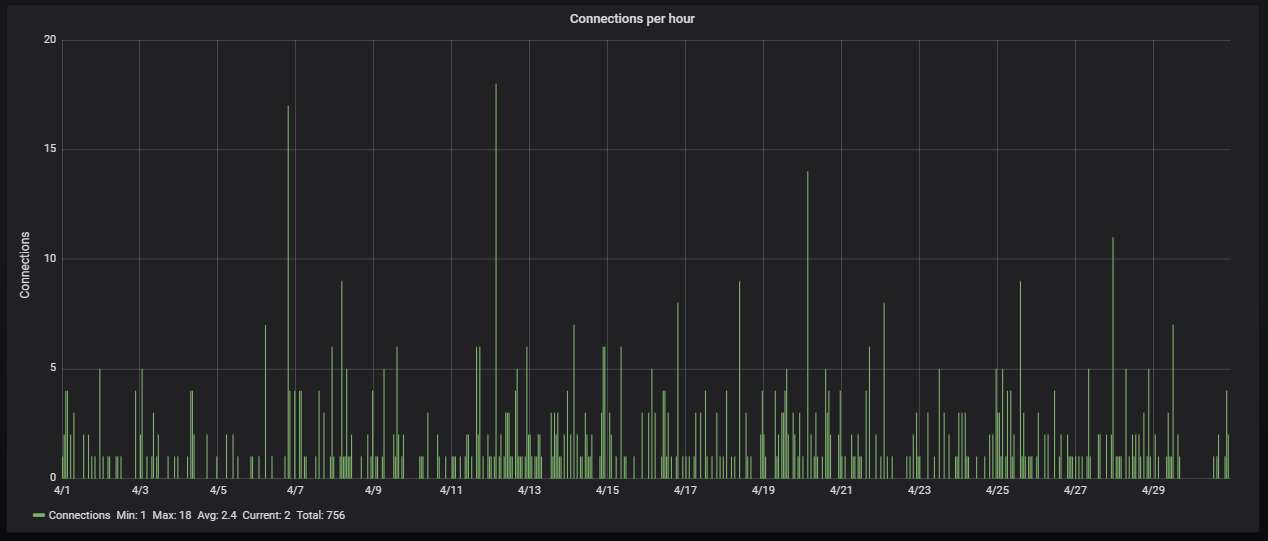
The hourly connection data, showing averagely slightly more than one attack every half an hour:
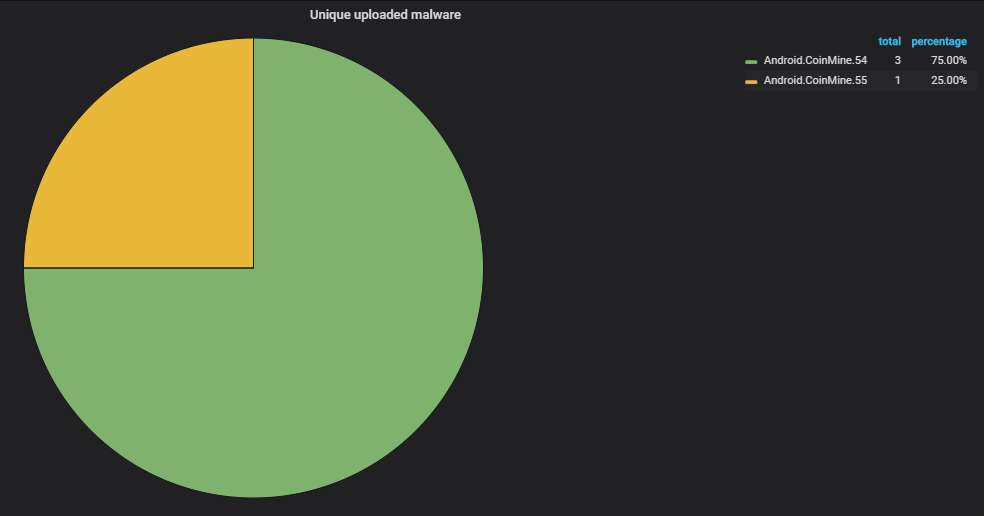
The unique malware uploaded to the honeypot, according to Dr. Web. Pretty much the same shit is being uploaded over and over - the ADB Monero mining worm that's causing most of the ADB traffic:
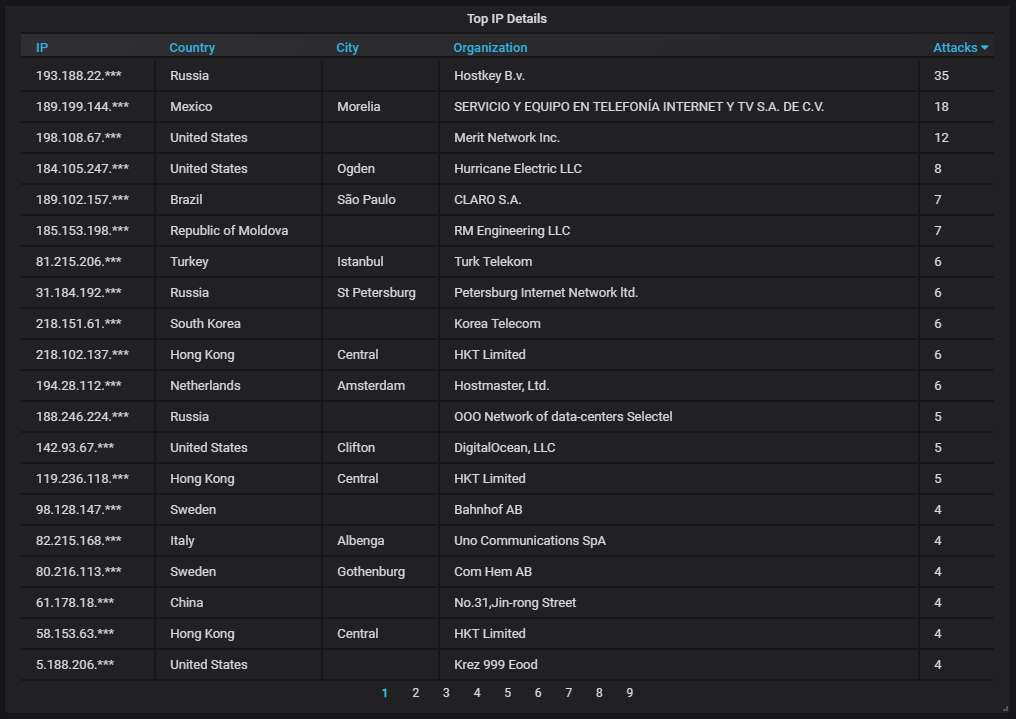
Details about the top-20 most actively attacking IPs:
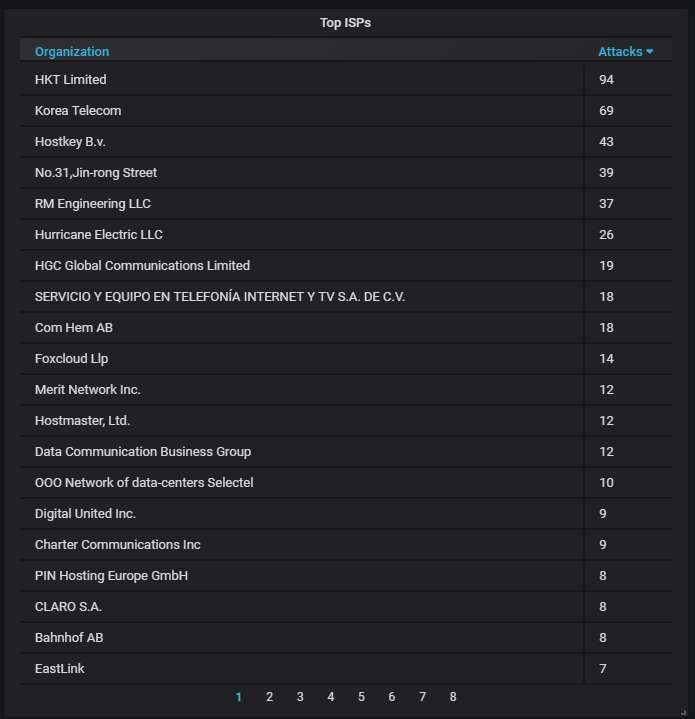
The top-20 organizations that own the IP addresses attacking us:
This concludes the April honeypot report.