Anatomy of a Virus Epidemic
[Bontchev02a] Proc. 12th Int. Virus Bull. Conf., 2002, pp. 389–406.
Abstract: The W97M/Groov.A virus appeared in 1998. This macro virus has one peculiar property - when it replicates on a Win98 or a WinME machine, it often saves the output of the program IPCONFIG into a text file and uploads this text file to our ftp site (ftp.complex.is). This property offers our company the unique opportunity to track the infections of this virus around the world and to attempt to notify its victims. This paper provides statistic data, illustrating how this virus has spread (and keeps spreading) and demonstrates that despite the fact that most anti-virus programs can nowadays detect and disinfect this relatively old and well-known virus without any problems, the virus keeps spreading in the wild with considerable success.
1 The Virus
In early 1998 a new macro virus, W97M/Groov.A, appeared. This, by itself was not anything new – even in those days new macro viruses were appearing at the rate of several per day. As a virus, it was rather unremarkable, too (see Appendix A for a complete description of it). The unusual thing about it was that, every time it replicated, with a probability of 1/5, it would run the Windows system program IPCONFIG, would save its output into a text file, and would upload this file to our ftp site (ftp.complex.is).
It is not quite clear to us what was the main idea behind this action. There are viruses that report back to their creators what machines they have infected – but this is obviously something quite different. There are viruses (e.g., W97M/Ping.A@mm) which perform denial-of-service attacks by constantly sending information to some particular site. However, the amount of information this virus sends is relatively too small to be anything more than a minor annoyance. There are viruses which attempt to slander well-known anti-virus producers by making it look as if these viruses have been written and released by those anti-virus people – but this particular virus doesn’t seem to have such a purpose, either. Maybe its behavior is just a way for the virus writer to “thumb his nose” at us and tell us “Hey, see, my creature is still alive and spreading!”. In any case, this property of the virus gives our company the unique opportunity to get a more clear picture of how it (and macro viruses in general) has spread (and keeps spreading) around the world.
2 Our Reaction
Initially, we considered the idea of simply blocking the uploads sent by the virus. Although it tries to use random file names (see Appendix A), it is relatively easy to detect these uploads and to block them before they have been uploaded to our ftp site. This would save us disk space (about 2.5 megabytes daily; see the next sections), time, and the annoyance of having to sort through the virus-uploaded mess every time we wanted to examine the legitimate virus samples uploaded by our legitimate customers. However, after some consideration, we decided against such blocking. Accepting the virus uploads instead and processing them gave us some valuable opportunities which, we decided, were worth the additional effort.
First of all, collecting the data uploaded by the virus allowed us to attempt to determine the source of the upload and to contact the owner of the infected machine – in order to warn them about the infection. This has the double benefit of helping to extinguish a virus infection and maybe winning a new customer. Second, analyzing the data allows us to get an important and valuable view of the overall picture of the proliferation of this virus.
Collecting the data was relatively easy. As mentioned above, despite the attempt the virus makes to use random file names for its uploads, it is relatively easy to recognize them. Our system administrator wrote a set of programs which would extract information about the uploader from the ftp log file and would periodically collect the uploaded files, compress them (so that they occupied less space) and move them elsewhere, so that they would not interfere with the “legitimate” contents of the incoming directory of our ftp site.
Contacting the victim turned out to be a tad more difficult. Certainly, the uploading (and, therefore, infected) machine could be identified by its IP number. However, this wasn’t of much use – unless we wanted to block future uploads from that machine, which we did not want to do. In order to contact the owner of the uploading machine, we needed a valid e-mail address. Furthermore, it was perfectly possible that the infected machine itself was not configured to receive e-mail directly. Therefore, we had to determine who was the postmaster for that machine (or subnet) and send our warning to that e-mail account.
This wasn’t very difficult to do technically – but, as usual, it was the human factor that caused the unforeseen problems.
First of all, many of the recipients of our warnings seemed to treat them as spam. They were either ignoring them (the most often encountered reaction) – or, in some cases, were even sending us rather inflammatory and angry messages. On some occasions, the recipient proceeded to block all connections to and from our site – without even bothering to investigate or to ask us what is happening.
In this aspect, our observations match those described in [FitzGerald99] – except that in our case the virus does not even attempt to make it look as if we are its author. It is rather strange, really – normally, common sense suggests that a person who receives a message “your machine is infected with a virus” would show at least a modicum of interest in the subject and would try to get rid of the virus. Unfortunately, it seems that common sense has become rather uncommon these days…
Second, it turned out that in many cases the “postmaster” of the infected machine was actually at the Internet Service Provider (ISP) company. Sadly, in many such cases the response we got was of the kind “This is someone of our customers; we’re an ISP; we couldn’t care less whether they are infected and can’t do anything about it”.
Eventually, we accepted the following procedure. We rewrote our warning letter, making it look as little as spam as possible. The complete text of the letter is provided in Appendix B. We also kept two lists. Every time a new postmaster account was identified, we would send them the letter – but only once, no matter how many uploads we have received from their machines. If the victim answered positively to the letter (as in “Yes, please continue sending us this information.”), we would put that e-mail address (or the new contact address suggested in the positive response of the victim) on one of the lists and would regularly send infection reports there. These infection reports contained the IP number of the uploading – and, therefore, infected – machine and also the user name and initials, as the virus records them from Word 97. If the postmaster choose to respond negatively – or not to respond at all; we decided not to make a difference between the two – his e-mail address was put on a second list and no further warnings were sent to that address, no matter how many uploads seemed to be coming from that source.
3 The Data
In addition to warning the victim, as described in the previous section, we also collected the raw data. In particular, for every upload sent by the virus we recorded:
-
Date and time of the upload (from the ftp logs).
-
User name and initials of the infected user (from the ftp logs).
-
IP number of the infected machine that had performed the upload (from the ftp logs).
-
The uploaded IPCONFIG report file itself.
For the purposes of this paper, the raw data for a particular period of time was processed, summarized and charted, in order to give a better, clearer picture of what is happening. The next sections deal with the different aspects of the results obtained from this processing.
3.1 Summary
We’ll start with a short summary of the results (see Table 1). The examined period covers the dates from 24-May-1998 to 14-Apr-2003 – or a almost 5 years. It should be noted that this is still an ongoing project – we have not stopped collecting data on 14-Apr-2003. However, for the purposes of this paper, we had to pick an end date (preferably, before the deadline for submitting the paper ), so that we could compute various averages.
During this period the virus has uploaded more than three and a half million IPCONFIG reports to our site, occupying a total of more than 4 gigabytes, and coming from more than half a million different infected machines in almost 150 different countries or more than 80,000 subnets. On the average, this means almost 2,000 uploads per day, occupying almost 2.5 megabytes of disk space, sent from almost 400 different machines, residing on about 50 different subnets.
There has been a spike in the activity of the virus on 12-Apr-2000 – a spike, which has resulted in a day with the maximum number of uploads, maximum size of these uploads, and maximum number of different machines sending the uploads. We do not know what might have caused this spike.
Examining the uploaded IPCONFIG reports shows that these more than half a million infected machines have a total of more than 5.5 million network adapters installed (or averagely more than 8 per machine – an unusually high number) of about 435 different kinds. (See also Section 3.10 for more information about the network adapters.)
During the period mentioned above, more than 9,350 victims have been contacted with a warning – at the rate of averagely 5 per day. (Note that this is just the number of initial warnings – it does not include the subsequent reports, had the victim opted to continue receiving them.) Of the people contacted with a warning, the vast majority (more than 97%!) have responded either negatively or not at all – and only less than 3% have exhibited interest to continue receiving the warnings. This is a truly appalling result and shows that the real reason why computer viruses continue to be a problem is not because the anti-virus people are unable to handle them but because most users simply don’t care.
| Starting date | 24-May-1998 |
| Ending date | 14-Apr-2003 |
| Time period |
1,786 days (4 years, 10 months, 21 days) |
| Total number of uploaded files | 3,544,444 |
| Average number of uploads per day | 1,985 |
| Total size of uploaded files |
4,620,720,204 bytes (4 Gb, 310 Mb, 678 Kb, 76 Bytes) |
| Average total size of the uploads per day |
2,587,189 bytes (2 Mb, 478 Kb, 565 Bytes) |
|
Maximum number of uploads in a single day |
5,882 (on 12-Apr-2000) |
|
Largest total size of uploads in a single day |
7,443,580 (on 12-Apr-2000) |
|
Largest number of different IP numbers uploading in a single day |
1,813 (on 12-Apr-2000) |
| Total number of different IP numbers seen | 694,392 |
|
Average number of different IP numbers seen per day |
389 |
| Total number of different IP subnets seen | 80,425 |
|
Average number of different IP subnets seen per day |
45 |
| Total number of network adapters | 5,643,256 |
| Number of different network adapters | 435 |
| Average number of network adapters per IP | 8 |
| Total number of countries | 146 |
|
Total number of people contacted with a warning |
9,362 |
| Average number of people contacted per day | 5 |
| Number of positive feedbacks | 258 (2.76%) |
| Number of negative feedbacks (or no feedback) | 9,104 (97.24%) |
3.2 Number of Uploads Per Day
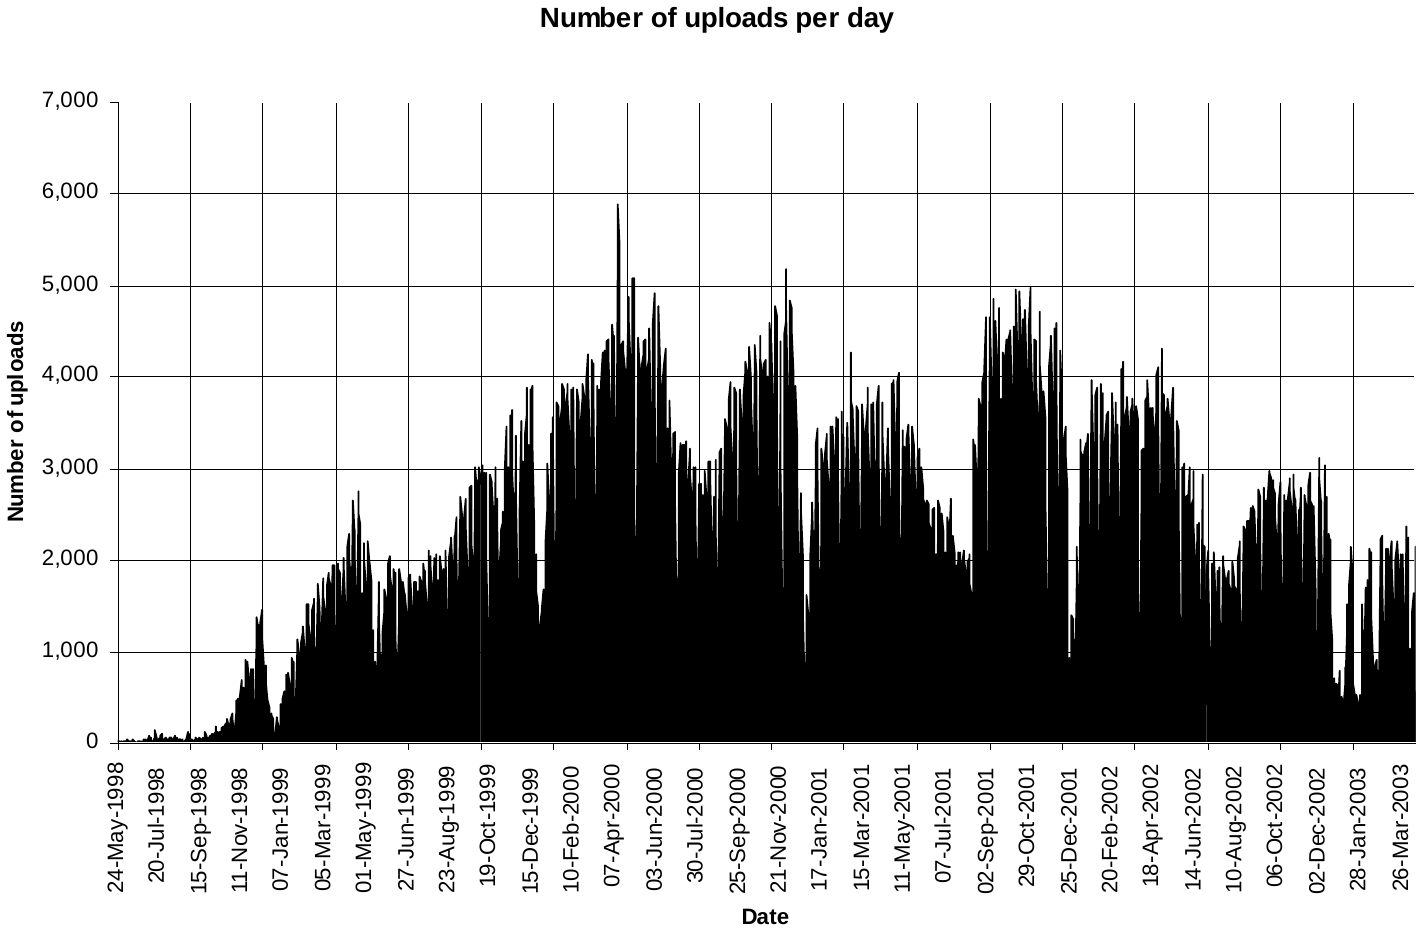 While, as listed in Table 1, on the average we have been receiving 1,985 uploads every day, their exact distribution over time shows a much more interesting picture:
Figure 1
The above figure shows that there was a relatively long period (May to September, 1998) when the virus was spreading very slowly. This was followed by a short period of almost exponential spread (October to November, 1998) – obviously, the virus “got lucky” at that time, possibly infecting some large and well-connected company. The explosive growth turned linear (January 1998 to April 2000) until the virus reached “saturation levels”. Then it basically remained at these saturation levels, despite the fact that at that time virtually all popular anti-virus programs were able to detect and remove it. Finally, the virus spread has been on a slow but steady decline since mid-2002.
Another interesting property of the above pattern is the clear and abrupt “slump” around late December of every year. It seems that Christmas is a truly universal holiday around the world and that people are more likely to take a vacation and not work during that time than, say, during the traditional summer season. Probably the explanation is related to the fact that summer falls in different parts of the year in the different parts of the globe.
Another interesting – but unexplained – pattern is the annual surge of activity around the month of April every year. Perhaps it is related to the fact that in many countries (and, mainly, in the USA) April is the period for submitting one’s tax return forms – an activity, during which the user is likely both to use Microsoft Word (i.e., the virus is likely to execute) and be connected to the Internet (e.g., in order to submit the tax return form on-line.
3.3 Sizes of the Daily Uploads
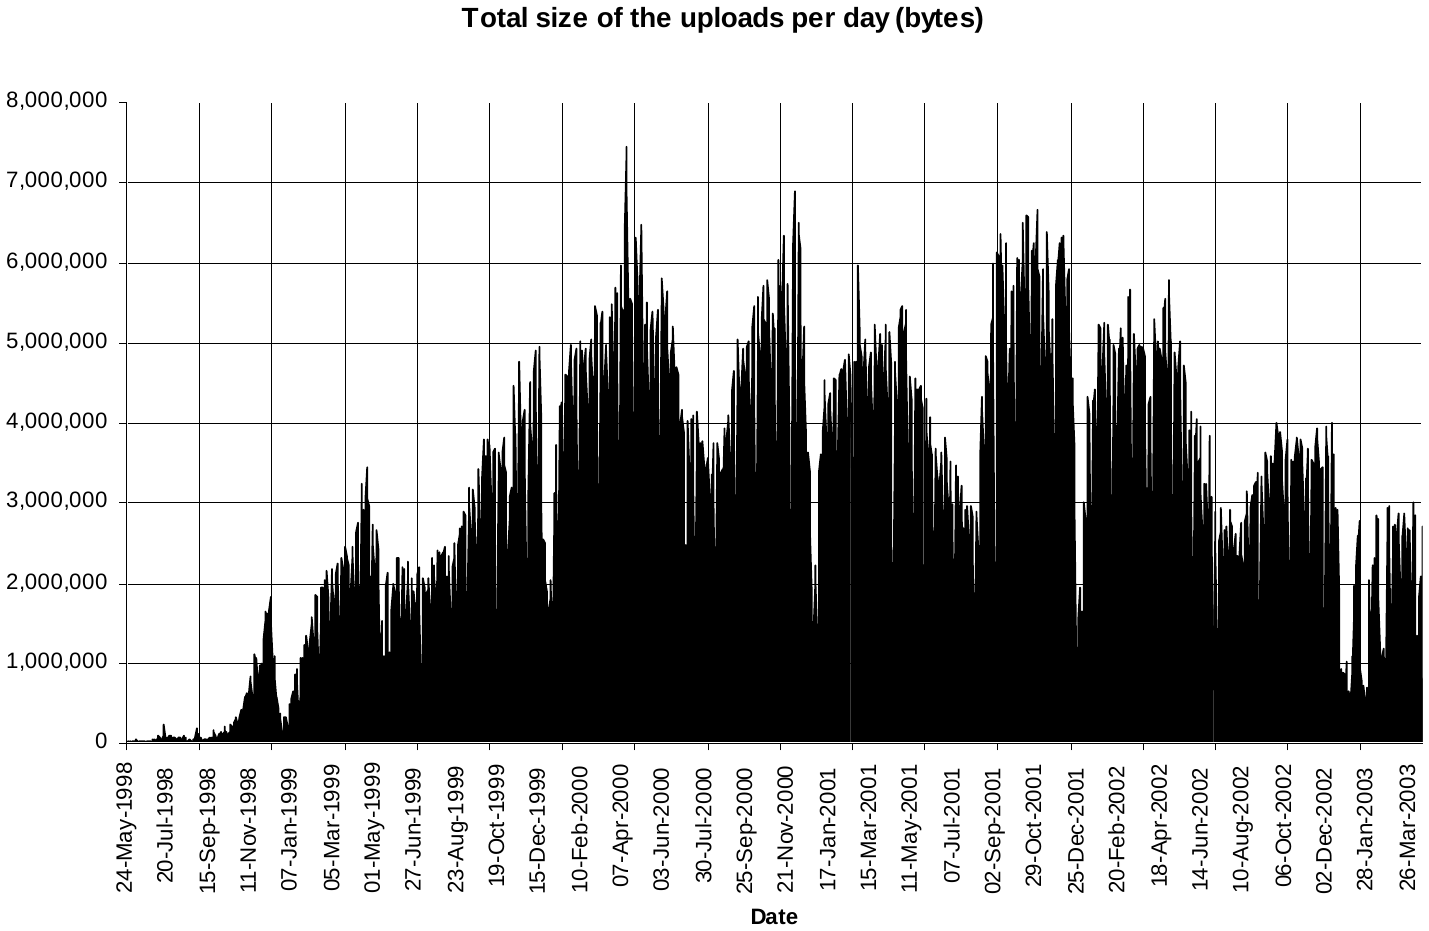 An alternative way of presenting the daily activity of the virus over the examined period of time is to chart the total size of the uploads sent by the virus on every particular day:
Figure 2
This metric confirms the results obtained from the previous one – that the virus had an initial quiet period of slow spreading, then got lucky and exploded for a short period of time. This provided it with a wide enough distribution base to sustain a long period of linear growth – until saturation levels were reached and the virus remained at those levels despite the best efforts of all the anti-virus products in the world. Finally, its spread started to decline – possibly due to the wider acceptance of newer versions of Microsoft Office which, by default, do not execute unsigned macros.
We also have a confirmation of the “seasonality” of the virus – with slumps around Christmas and spikes around the month of April each year.
3.4 Different IP Addresses Per Day
Finally, if instead of the number of uploads per day or their sizes, we chart the number of different IP addresses from which these uploads are coming every day, we get a very similar picture:
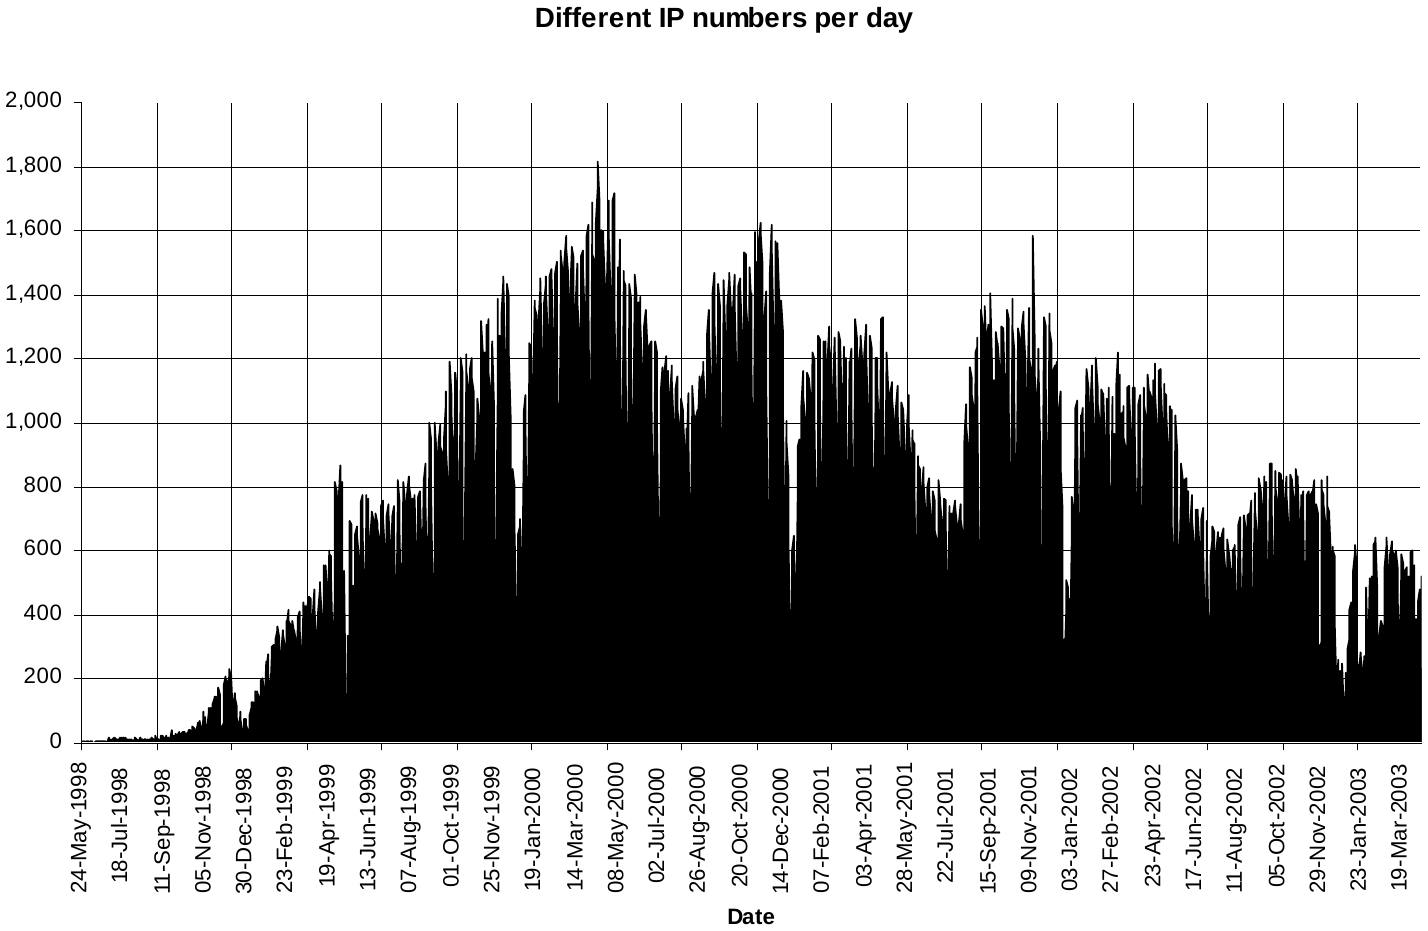 Figure 3
Although somewhat “smoother” than the previous two charts, the chart on Figure 3 shows that this metric (number of different IP addresses per day) confirms the observation suggested by the previous two metrics – namely, that the virus had a period of slow accumulation, followed by a short period of explosive growth, followed by a long period of linear growth, until the “saturation” levels have bee reached and then the virus has stabilized there, then it has started slowly to decline.
The seasonal patterns (slumps around Christmas and spikes in April) are also confirmed.
3.5 Uploads Per IP Address
Another interesting information that can be obtained when analyzing the collected raw data is the “life span” of the virus per infected host or site. That is – how many times has the virus replicated on a particular machine (or on a particular site) before having been noticed and removed. The following graph attempts to answer this question by charting the number of times the different IP addresses have sent uploads to our site:
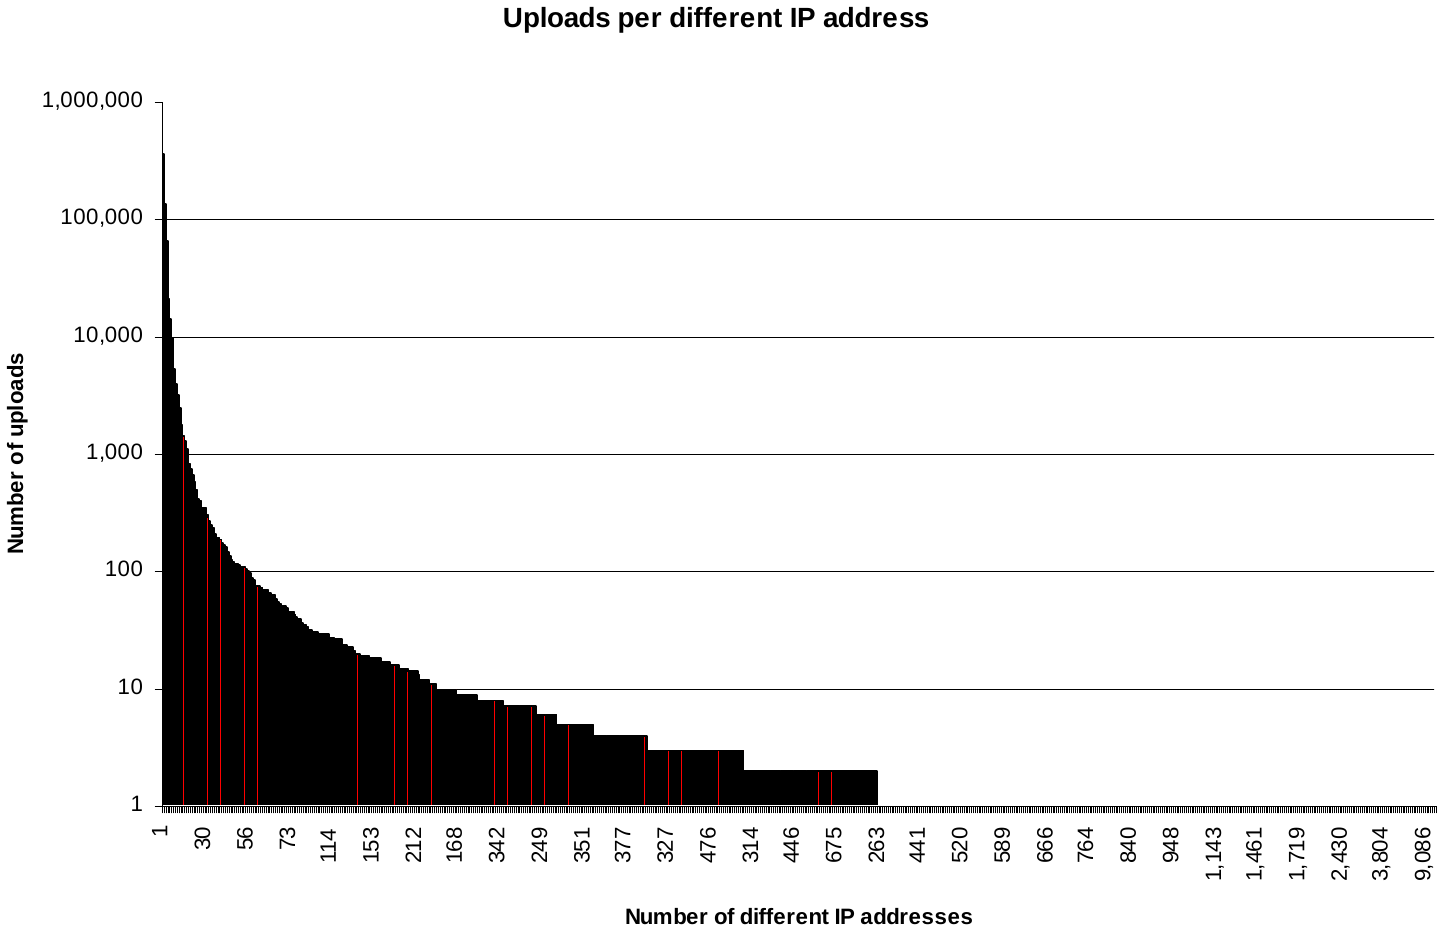 Figure 4
There are some interesting observations that can be made from the above graph.
In the majority (more than 52%) of the cases, we have received only a single upload per IP number. Of course, it is possible that the results are skewed by the fact that many ISPs assign IP numbers dynamically to their subscribers. That is, one and the same machine can have a different IP number assigned to it from one Internet connection session to another.
Nevertheless, the fact that in almost 96% of the cases one and the same IP number has sent 10 uploads (or less) to our site supports the conjecture that in every particular case the virus is discovered and removed relatively quickly. Table 2, which is a subset of the complete data and covers only the cases when one and the same IP number has sent 1 to 10 uploads illustrates this.
| # IP Addrs: | Times Uploaded: | Percentage: |
| 364,153 | 1 | 52.44% |
| 137,649 | 2 | 19.82% |
| 64,316 | 3 | 9.26% |
| 35,527 | 4 | 5.12% |
| 21,466 | 5 | 3.09% |
| 14,155 | 6 | 2.04% |
| 9,816 | 7 | 1.41% |
| 6,890 | 8 | 0.99% |
| 5,294 | 9 | 0.76% |
| 4,019 | 10 | 0.58% |
| # IP Addrs: | Times Uploaded: |
| 1 | 14,848 |
| 1 | 20,653 |
| 1 | 22,585 |
| 1 | 33,097 |
| 1 | 71,038 |
The IP numbers that have caused more than 10 uploads each are only about 0.5% per each particular number of uploads. Still, there are some pretty amazing cases, as shown in . The last case listed there that has resulted in the upload of 71,038 IPCONFIG uploads should be ignored – it reflects the total number of cases when we have been unable to identify the host (e.g., because its IP number is no longer valid). However, the remaining four are real ones. Three of them come from the domain *.k12.il.us – that is, they are three different kindergartens in the state of Illinois, USA. If we consider just one of them, it has sent 33,097 uploads to our site during the period for which we have been collecting such data – i.e., on the average more than 18 uploads per day – every day, continuously for almost 5 years. One cannot but wonder what kind of IQ has the user of a machine with such an active virus on it, especially given the fact that we have sent a warning to them! And these people are supposed to teach our children…
3.6 Uploads Per IP Subnet
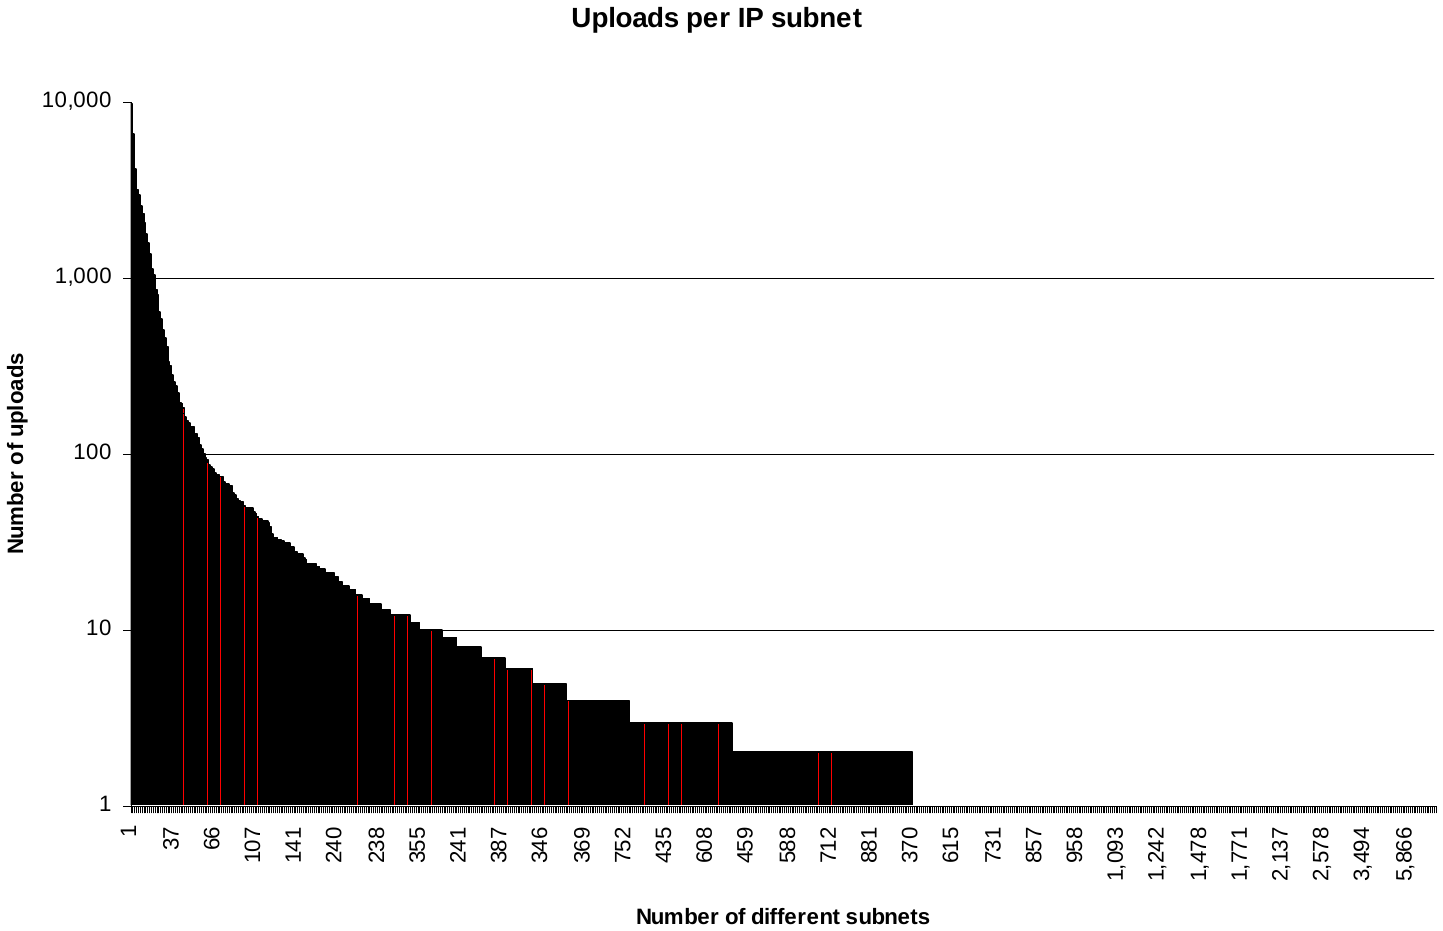
In an attempt to alleviate somewhat the problem related to the fact that many ISPs assign IP numbers dynamically to their subscribers, we have computed the same kind of statistic as in the previous section – but computed it on a per IP subnet basis, instead of on a per IP number basis. The idea is that even when an ISP assigns IP numbers dynamically, it is most likely to assign IP numbers from a very limited range, called a subnet. Our definition of a subnet is somewhat arbitrary – we assume that if the first three octets of two (or more) IP numbers are the same and they differ only in the fourth octet, then these IP numbers are on the same subnet.
While this simplification shows a slightly more “normal” distribution, it still demonstrates that most of the uploaders sent their IPCONFIG reports only a few times. This supports the notion that the virus is discovered and removed relatively quickly in each particular case. Nevertheless, it is amazing that the short time during which it is allowed to replicate seems to be sufficient to sustain its relatively stable population in the wild.
The next two tables and chart are equivalent to Table 2, Table 3 and Figure 4 respectively, except that they refer to subnets of IP numbers instead of to particular IP numbers.
| # of IP subnets | Times uploaded | Percentage: |
| 9,652 | 1 | 12.00% |
| 6,593 | 2 | 8.20% |
| 4,994 | 3 | 6.21% |
| 4,187 | 4 | 5.21% |
| 3,597 | 5 | 4.47% |
| 3,225 | 6 | 4.01% |
| 2,966 | 7 | 3.69% |
| 2,767 | 8 | 3.44% |
| 2,549 | 9 | 3.17% |
| 2,334 | 10 | 2.90% |
 # of IP subnets |
Times uploaded |
| 1 | 20,654 |
| 1 | 21,790 |
| 1 | 22,686 |
| 1 | 49,725 |
| 1 | 71,038 |
Figure 5
3.7 Weekday Activity
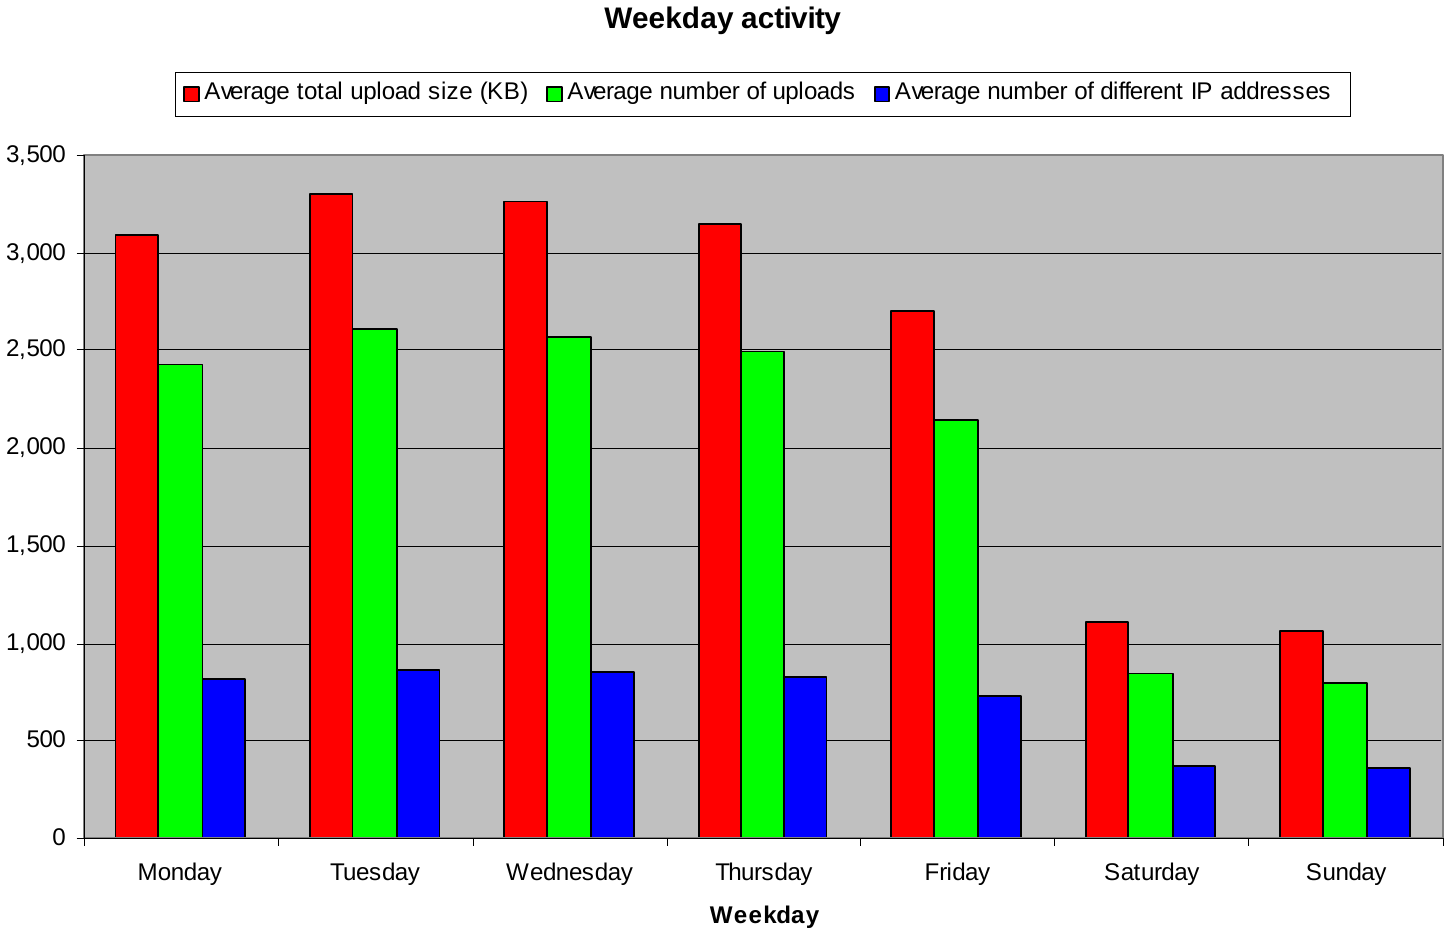 Another interesting statistic that can be obtained by digesting the raw data we have collected is the frequency of virus replications (only for this particular virus, of course) on the different days of the week. Common sense suggests that this frequency will be much lower during the weekends and much higher on Monday, when people come to work and use more actively their computers, while processing the work that has accumulated over the weekend.
Figure 6
Interestingly, as shown by Figure 6, this does not quite seem to be the case. The reduced activity during the weekends is clearly visible – but the “most active” weekday seems to be Tuesday (although Wednesday comes quite close to it), not Monday. As suggested by [Kuo01], this is probably due to the fact that most infections are in the USA – and there Monday is more often a holiday than any other day of the week (except the weekends, of course).
3.8 Monthly Activity
The graph of the monthly activity of the virus (Figure 7) shows some clear seasonal patterns. As expected, the summer months (June – August) are a time of reduced activity. Surprisingly, however, the busyest months are not September (when the summer vacations are over) and December (when people are working harder in order to meet the annual deadlines) – but April and March. Currently we do not have an explanation of this phenomenon.
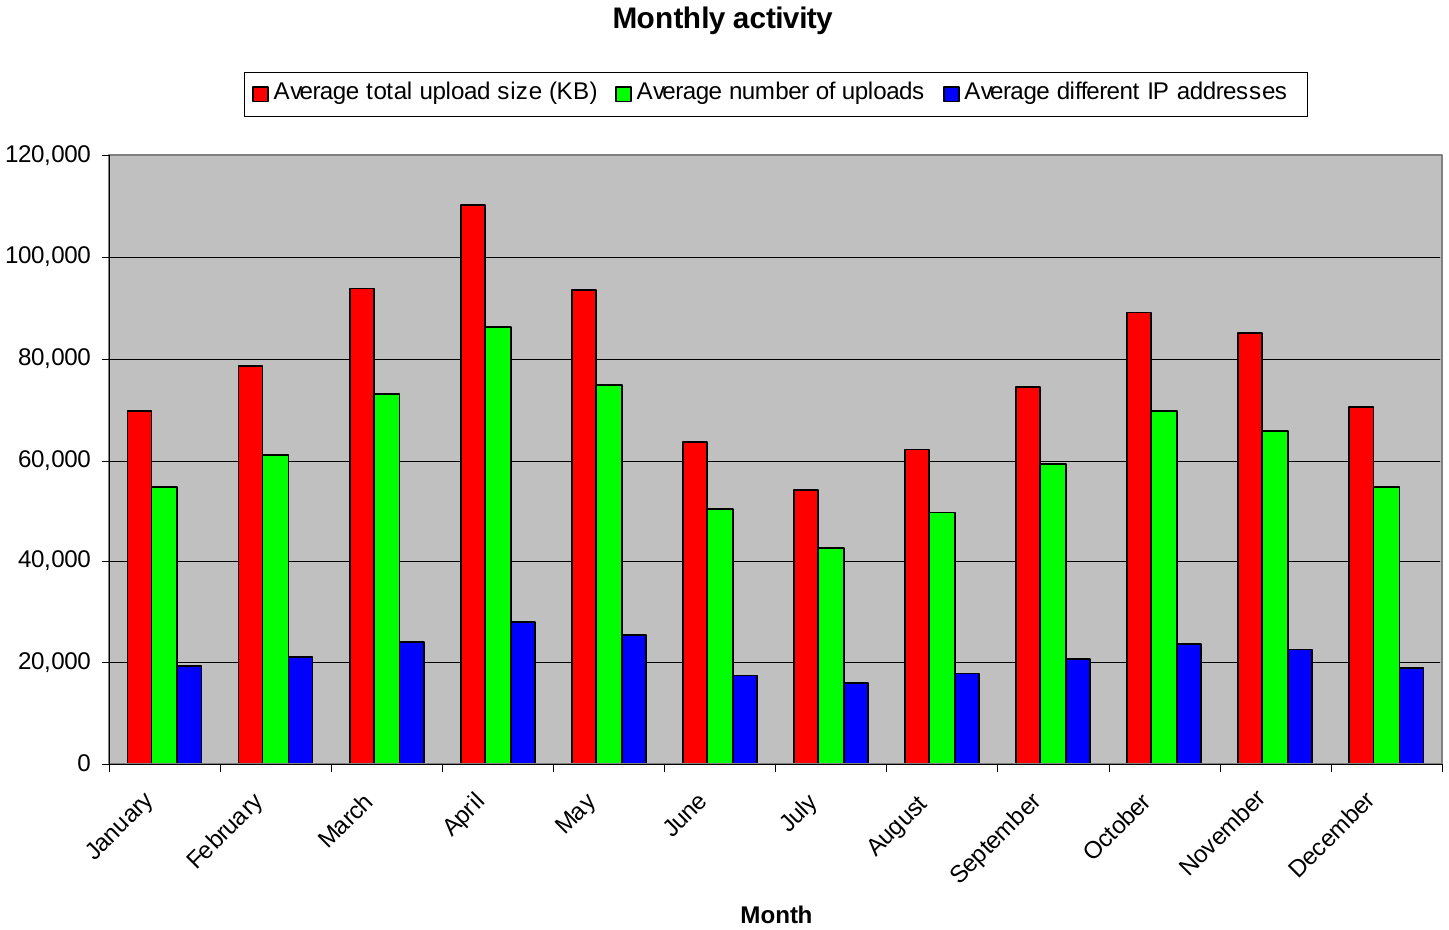
Figure 7
3.9 Geographical Spread
One of the most interesting questions about a computer virus is how well it spreads around the world. Since we get the IP numbers of the infected machines, and since these IP numbers are unique on the Internet, theoretically this information should be sufficient to determine how the virus has spread around the world.
In practice, however, the task of matching an IP number to the geographical location of the machine it corresponds to, is a very non-trivial one. We tried contacting several authorities, responsible for the allocation of IP subsets to various countries around the world – but the response from them was not very useful. The information they provided us could identify the geographical location of less than 5% of the different IP numbers we had collected.
Finally, a colleague anti-virus researcher from Romania, Mr. Costin Raiu, turned our attention to a tool, called GeoIP and produced by MaxMind (http://www.maxmind.com). This is an Open Source tool which can be compiled for various operating systems. Since the machine, on which we collected our data was a Linux machine, the tool proved exceptionally convenient and useful for our needs.
The database of IP numbers and geographical locations, supplied with this tool, was able to identify the geographical location of almost 98% of the IP addresses we had collected. In many cases it was able to identify even the state and the town, where the IP address was located. However, we decided that a country-level granularity was precise enough. Figure 8 below shows the cumulative geographical spread of all infections, for which we have collected IP numbers.
Figure 8
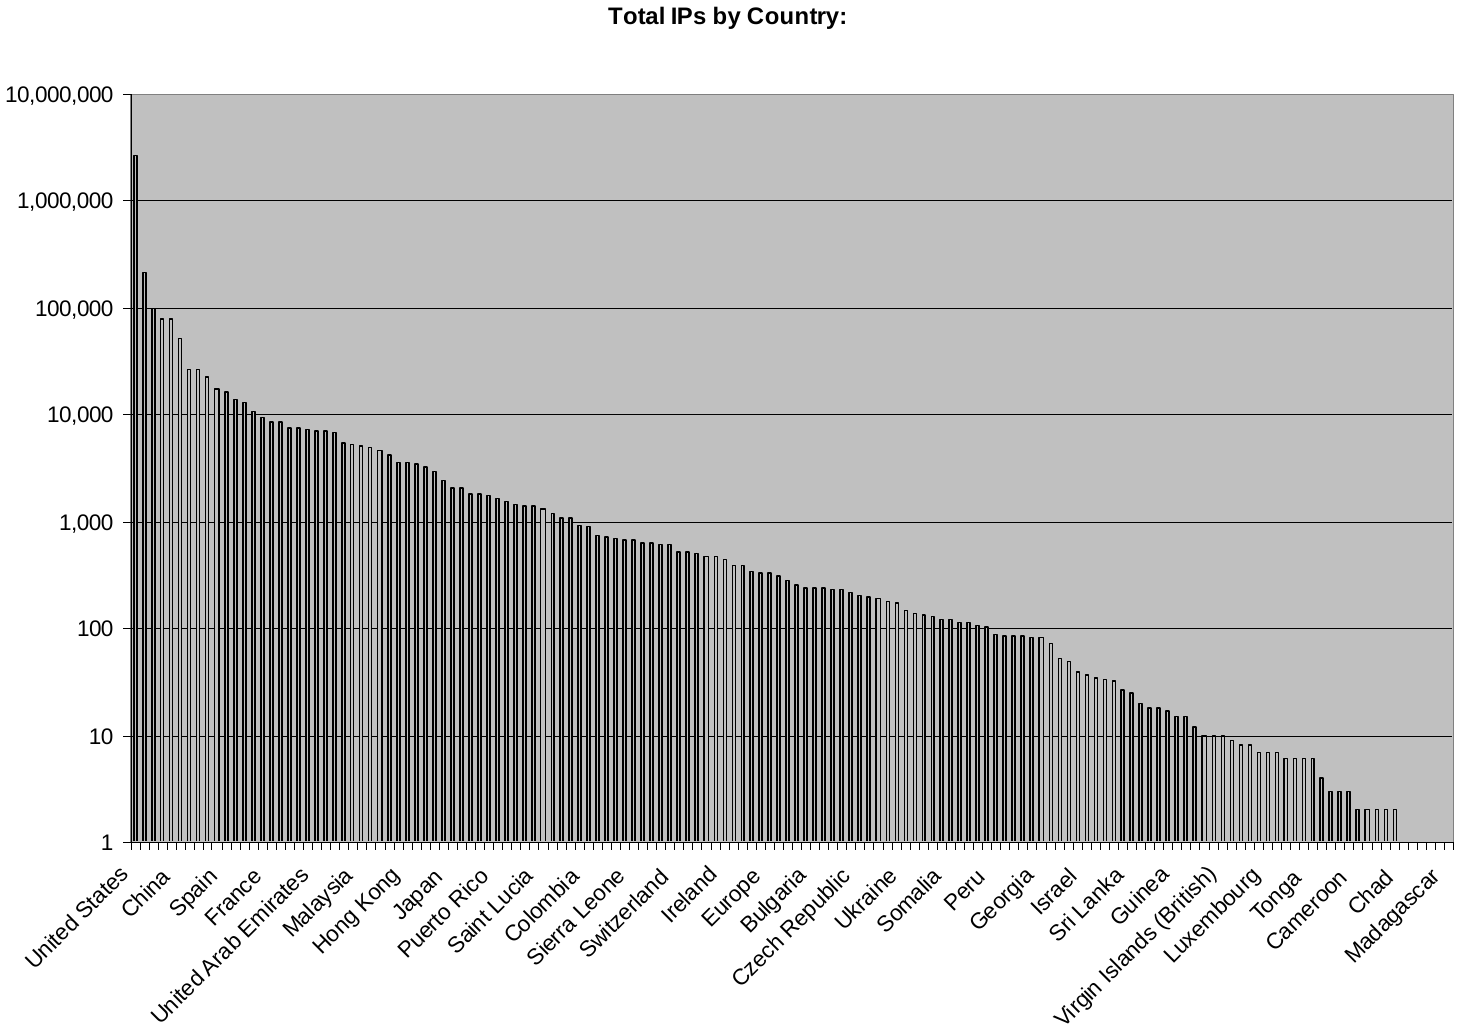 As expected, the vast majority of the infections have occurred in the USA – more than 76% of them. This is natural, given how highly computerized this country is (as well as the relatively low level of sophistication of the average computer user there ). The remaining 9 countries on the “top 10” list are responsible for about 2/3 of the remaining infections – another unsurprising result.
A bit more surprising is the actual distribution across some specific countries. For instance, it is normal to find such well-computerized countries like Australia, Canada, Spain, the UK, Taiwan or France on the “top 20” list – or such big countries like Mexico, India, China, Brazil or Russia. However, finding Panama, Guatemala, Costa Rica, Oman, Venezuela and the Dominican Republic there is a bit odd…
The relatively low number of infections coming from such well-computerized countries like Japan, Hong Kong, Germany, Switzerland and the Netherlands can probably be explained by the wide use of anti-virus software there. Notably, though, this use has not erradicated completely the virus in these countries. For curiosity’s sake, Bulgaria is number 76 on the list (containing 146 members) and Iceland is number 114.
Of course, many countries of the world are not present at all – if computers, Microsoft Office, and/or the Internet are not very widespread there. For instance, Iraq and Afganistan are absent.
3.10 Network Adapters Used
Processing the contents of the uploaded IPCONFIG reports allows us to get an impression of what are the most widely installed Ethernet adapters in the world. It should be noted that these are the names reported by the software drivers (and these names can sometimes be rather bizarre) – they are not necessarily the names of the installed network cards.
Assuming that each of the different IP numbers from which the upload has originated corresponds to a different machine (a rather liberal assumption – because of the fact that many IPSs assign IP numbers dynamically to their customers, it is very likely that one and the same machine has sent uploads to our site while being assigned different IP numbers), the fact that we have seen more than half a million different IP numbers and more than 5.5 million Ethernet adapters are listed in the uploaded IPCONFIG reports suggests averagely more than 8 adapters per machine. This might seem a lot – but, for instance, the machine on which this paper was written has a single network card installed – yet on it IPCONFIG lists 3 different Ethernet adapters.
There are 435 different kinds of Ethernet adapters that can be found in the uploaded reports. However, the 10 most often encountered ones cover almost 91% of the total of more than 5.5 million adapters listed in these reports. These 10 most often encountered adapters are listed in Table 6 below.
| Adapter name: | # found: | Percentage: |
| PPP Adapter. | 3,075,168 | 54.49% |
| AOL Adapter | 948,580 | 16.81% |
| AOL Dial-Up Adapter | 429,473 | 7.61% |
| Novell 2000 Adapter. | 172,587 | 3.06% |
| Intel(R) PRO PCI Adapter | 146,506 | 2.60% |
| 3Com EtherLink PCI | 136,302 | 2.42% |
| NDIS 5.0 driver | 80,982 | 1.44% |
| Microsoft TV Data Adapter. | 55,558 | 0.98% |
| Realtek 8139-series PCI NIC | 48,493 | 0.86% |
| SiS NIC SISNIC | 39,068 | 0.69% |
4 The Problems
The information obtained from the data we have collected, while useful, does not provide a complete and precise enough picture of the distribution of the W97M/Groov.A virus. In particular, the problems that introduce various levels of inexactness and skew the general picture are:
-
Only connected victims are covered. Obviously, if the infected machine is not connected to the Internet, the virus will be unable to upload anything to our ftp site and no information will be obtained about the infection. This problem implies that in reality the virus could be more widespread than our data suggests.
-
Only some Windows platforms are covered. As mentioned in Appendix A, the way the program IPCONFIG is used by the virus works only under Windows 98 and Windows ME. It does not work under Windows 95, Windows NT 4.0, or Windows 2000, for instance – because there the program IPCONFIG uses a slightly different command-line syntax. Consequently, under these operating systems the virus will fail to create a report file and will have nothing to upload to our ftp site. This problem implies that the virus could be significantly more widespread than our data suggests.
-
Only one of every five replications is detected by us. As mentioned in Appendix A, when the virus replicates, the creation of an IPCONFIG report and its uploading to our ftp site occurs with a probability of 1/5. This means that our data does not reflect at least 80% of the replications of the virus. Since, in some cases, the virus will be discovered and removed before its probabilistic mechanism has had the chance to upload an IPCONFIG report to our ftp site, this means that the virus is much more widespread than our data suggests.
-
Inexact identification. We do not receive samples of the virus itself – we receive only IPCONFIG reports uploaded by it to our ftp site. The W97M/Groov virus family consists of several dozen viruses, many of which are undistinguishable from each other when looking only at the IPCONFIG reports they upload. This means that the infections we are observing could be (and probably are) caused not by one and the same virus but by several closely related (but, nevertheless, different) virus variants. Therefore, any statements about the widespreadness of a particular virus variant (W97M/Groov.A) that are based solely on the data we have collected are inherently imprecise.
-
Dynamic IP numbers. Nowadays many ISPs assign dynamically IP numbers to their customers. This means that one and the same machine will have different IP number from one Internet connection session to another. From our point of view, we would see different IP numbers in the IPCONFIG reports uploaded by the virus – despite the fact that they are coming from one and the same machine. Therefore, the number of different infected machines could be less than our data suggests.
-
Imprecise IP subnet definition. Our definition of the term “IP subnet” is rather arbitrary – we assume that all machines with IP numbers that have the same first three octets reside on the same IP subnet. In reality, in many cases the IP subnet number is encoded differently (e.g., in the first 20 bits of the IP number, instead of in the first 24 bits of it). Furthermore, many sites have more than one IP subnet. Therefore, our statistics do not provide a precise enough picture of the number of different infected sites.
-
Imprecise definition of “different”. When counting the number of different IP numbers (or subnets) that have uploaded IPCONFIG files to our site on a particular weekday or month, this number reflects the different IP numbers seen only on that particular day or month. That is, all of them are not necessarily different from the IP numbers seen during the previous day or months.
Nevertheless, despite all the problems mentioned above, we believe that the results based on the processing of the data obtained by us are significantly more precise and reliable than, say, those obtained from human reports of sightings of the virus.
5 Conclusions
The results obtained from processing the raw data we have collected allow us to draw several different conclusions:
-
A virus which does not spread explosively (e.g., is not a mass-mailing worm like W97M/Melissa.A@mm or VBS/LoveLetter.A@mm), even if it has a “successful” replication mechanism and manages to make it in-the-wild, needs a significant period of time (about a year and a half) to reach “saturation” levels.
-
Before reaching saturation levels, the virus has a period of slow growth, followed by a short period of explosive growth, as it “gets lucky”, followed by a prolonged period of linear growth.
-
Once a virus has reached saturation levels in-the-wild, it is extremely difficult to exterminate it. Its widespreadness could fade a bit and/or be subject to seasonal fluctuations – but, nevertheless, the virus remains at high levels of proliferation for a long time.
-
It is basically irrelevant whether the anti-virus products are able to handle a virus once it has reached saturation levels – they will remain unable to eradicate it. The event that is most likely to lead to its eradication is the wide acceptance of a computing platform under which the virus is no longer able to replicate properly.
-
The vast majority of the infected users (more than 97%) are too complacent and do not care about virus infections. They either do not employ any reasonably up-to-date anti-virus products in the first place (if they did, the virus would not have been able to infect their machines, since nowadays most popular anti-virus products detect this virus without problems – see Appendix C), or are inclined to ignore direct and explicit warnings that their machines are infected (or both). This is the real reason why computer viruses are still an increasing problem – not the “genius” of the virus writers or the “incapability” of the anti-virus producers to cope with the problem. This conclusion of ours nicely confirms similar results from a previous work ([FitzGerald99]) – but we also provide statistical data confirming the general observation made in that work.
-
The users work more actively with their machines (and/or are more complacent, as far as computer viruses are concerned) on Wednesdays and Tuesdays and during the months of April and March.
-
Except in a few extreme cases, the virus is discovered and removed relatively quickly – after only a few replications. Nevertheless, this turns out to be enough for it to replicate further and to sustain its relatively high level of proliferation.
-
Infection reporting services like the WildList Organization (http://www.wildlist.org) or the technical support departments of the anti-virus companies which rely on receiving samples of a virus in order to count it as “spreading in the wild” do not give us even a fractional percentage of the real picture in respect of how widespread a virus really is – precisely as mentioned in [Bontchev99] and [FitzGerald99]. This is mostly because the users either fail to notice the infection or do not bother reporting it, especially if their anti-virus product is able to remove the virus without problems.
-
The vast majority of the infections (76%) are in the USA. This is certainly not surprising, given how highly computerized this country is. However, it is suprising to find countries like Panama, Guatemala, Costa Rica, Venezuela and the Dominican Republic in the top 20 infected countries.
6 Acknowledgments
We would like to use the opportunity to express our deep gratitude to Mr. Einar Indridason, system administrator at FRISK Software International. From his point of view, the daily upload of 2,000 files caused by the virus were just an annoyance and a waste of 2.5 megabytes of perfectly good disk space – and he would have rather modified the ftp server to reject these uploads automatically. Nevertheless, he complied with our request to collect and archive all these uploads, so that useful statistical data could be obtained form them.
Furthermore, he undertook the job of notifying all the hapless victims of the virus, warn them that their machines were infected, pointing them to a selection of anti-virus products suitable for dealing with it (ours was, of course, one of them – but products of our competitors were listed, too, if they were well-known and able to remove the virus properly; see Appendix B for the full text of the letter), and offering them detailed reports regarding which of their machines and users were causing the virus-related uploads to our site. Most of the time, his efforts were either ignored by the users mentioned above, or he was flamed – because the users thought that we were trying to spam them and to promote our anti-virus software.
Finally, at our request, he wrote the set of tools necessary to digest the raw data we have collected – data, which was scattered among ftp log files and collected IPCONFIG reports uploaded by the virus. Without his contribution, this paper would not have been written.
7 References
- [Bontchev99] Vesselin Bontchev, “The WildList – Still Useful?”, Proc. 9th Virus Bull. Conf., 1999, Vancouver, Canada, pp. 281-287. (Full text also available on-line from http://www.people.frisk-software.com/~bontchev/papers/wildlist.html.)
- [FitzGerald99] Nick FitzGerald, “Monkeying with the WildList”, Proc. 9th Virus Bull. Conf., 1999, Vancouver, Canada, pp. 247-268.
- [Kuo01] Jimmy Kuo, personal communication.
Appendix A. Description of the W97M/Groov.A Virus
The W97M/Groov.A virus consists of a single VBA module named “groovie”. It intercepts 3 auto subroutines (AutoOpen, AutoClose and AutoExit) and 4 system subroutines (FileSave, FileSaveAs, FileClose and FilePrint) and replicates in both directions (to documents and to global templates) when any of them receives control. Additionally, for “stealth” purposes it intercepts the system subroutines ToolsMacro, FileTemplates and ViewVBCode. The first two of them do nothing – they just prevent the corresponding system functions from being executed. The third displays a message box with the message “• ALT-F11 • says...” and the title “It's GROOVIE” (besides preventing the VBA Editor from being invoked).
When it receives control, the virus first turns off the built-in macro virus protection of Word 97, the prompting when saving the global template, and the prompting when a document conversion is required. Then the main replication code of the virus is invoked. This replication code first checks whether the virus is running from an infected document or from an infected global template. Then it determines what parts of the system are infected, it infects those that are not and, if the global template is not write-protected, deletes the “Tools/Macro” and “Tools/Templates and Add-Ins…” menu items.
When infecting a clean system, the virus saves a copy of itself in a file named “data.dot” residing in the Startup folder of Word 97. The module that contains the virus in this file is named “orbit” – not “groovie”, like the name of the module in the normally infected documents or global templates. The idea behind this additional copy of the virus is that even if the user removes the infected global template (e.g., in an attempt to remove the virus manually), when Word 97 is launched, it will also load all global templates (and the macros residing in them) from the Startup folder – and, therefore the virus. The virus will then re-infect the normal global template.
The virus recognizes itself in the infected documents by the presence of a VBA module named “groovie”. If, at the time when it tries to infect a document, the virus determines that the file “data.dot” has not been created yet, it creates this file and also executes the system program LABEL, instructing it to change the volume label of drive C: to “groovie”. If, at the time when it tries to infect a global template, the virus determines that there is an open document, it changes the Comments field in the file summary information of this document to “ALT-F11 says it's groovie!”.
The virus replicates by using the VBA commands .Export and .Import – and a file named “c:\groovie.sys” to store its source.
Finally, after replicating itself and with a probability of 1/5, the virus runs the system program IPCONFIG, saves the report it produces into a file named “c:\ip.txt” and uploads this file to the ftp site of FRISK Software International. The exact command line issued by the virus is
ipconfig /all /batch c:\ip.txt
Note that this works only under some versions of Windows – for instance, the IPCONFIG program supplied with Windows 95, Windows NT 4.0 or Windows 2000 does not support the /BATCH command-line option. In practice, this leaves only Windows 98 and Windows ME. That is, only when replicating under one of these two operating systems, the virus will be able to send an IPCONFIG report.
Then the virus generates a random number between 0 and 999 and obtains the name and initials of the user, as registered in Word 97. They are used when uploading the IPCONFIG report to the ftp site of FRISK Software International. The virus logs in as anonymous user, using the password
<user_name>@<user_initials>.com
where “<user_name>” and “<user_initials>” are the user name and initials obtained from Word 97. It then uploads the file “c:\ip.txt” under the name
<number>.<user_initials>
where “<number>” is twice the generated random number.
Appendix B. Text of the Warning Letter Sent to the Victims
Hello there. This message comes as a result of a virus infection on one (or more) of your PC machines. Why do I know this? Well, the payload of that virus is to upload a certain textfile to our ftp site, ftp.complex.is.
Sounds unlikely? I can only try to assure you that I'm not joking. Why us? Well, it might be because we produce an antivirus program, F-PROT, and the virus author might have a grudge against us. Maybe the virus author wanted to create a denial-of-service attack against us by hoping that many machines would upload this file at the same time and therefore crashing our server.
The name of this (macro) virus is W97M/Groov.A, and every recent anti-virus program should be able to find and disinfect it.
For further information about this virus see:
http://vil.nai.com/vil/virusChar.asp?virus_k=98011
http://www.f-secure.com/v-descs/groovie.htm
http://www.antivirus.com/vinfo/virusencyclo/default5.asp?VName=W97M_GROOVIE&VSect=T
http://www.avp.ch/avpve/macro/word97/groovie.stm
Now, I have a list of timestamps and hostnames where this textfile was uploaded from, which can help track down the infected machines. Trouble is that the information we have isn't sufficient to pinpoint the exact username and therefore we can't warn the user directly. We only have the "username" as MS-Word has stored it, but having the timestamps, the hostname, and the "username" might enable you to track down the user and warn him.
So the question is: Do you want to receive such a warning with a list of timestamps, hostnames and "usernames"? If so, to what address should I send it to? Postmaster address or some other address?
Additionally (and I hate to use similar terminology as the blasted spammers ) "this is a one time only post" - you shouldn't receive further messages like this.
Please contact us before you block us. (Or at worst, just ignore us.) We can be reached as:
einari@complex.is Postmaster and other hats at Complex.is
bontchev@complex.is Anti-virus researcher
All the best,
--
Oh, by the way, the "current" list looks like the following: (Our timezone is GMT+0000 or UTC, the "name" is the name as stored by MS-Word)
Appendix C. List of the Anti-Virus Products Detecting the Virus
| Company: | Product: | Version: | Date: | Detects as: |
| ALWIL AVAST! | LGUARD | 7.70-53 | 31-May-2001 | MW97:AntiSR1 family |
| CAI | VET RESCUE | 10.3.2.0 | 31-May-2001 | Word97Macro/Groov.A |
| Dialogue Science | DrWeb386 | 4.24 | 01-Jun-2001 | W97M.Groovie |
| ESET | NOD32DOS | 1.87 | 22-May-2001 | W97M/Groov.A |
| FRISK Software | F-PROT | 3.09a | 29-May-2001 | W97M/Groov.A |
| GeCAD | RAV | 8.1.001 | 02-Jun-2001 | W97M/Groov.AN |
| GRISoft | AVGLite | 6.256/129 | 31-May-2001 | W97M/Groov |
| Kaspersky Lab | AVPDOS32 | 3.0/132 | 02-Jun-2001 | Macro.Word97.Groovie |
| Network Associates | ScanPM | 4.13.0 | 03-Jun-2001 | W97M/Groov.gen |
| Norman Data | NVC32x | 4.91.00 | 30-May-2001 | W97M/Groov.A |
| Panda Anti-Virus | PAVCL | 02-Jun-2001 | W97M/Groov.AN | |
| SOFTWIN | AVXC | 5.9.1 | 02-Jun-2001 | W97M.Groov.AH |
| Sophos | SWEEP | 3.46 | 04-Jun-2001 | WM97/Ipattack |
| Symantec | NAV CE | 7.0 | 29-May-2001 | W97M.Groov.A |
| Trend Micro | PCSCAN | 7.31/895 | 01-Jun-2001 | W97M_GROOVIE |